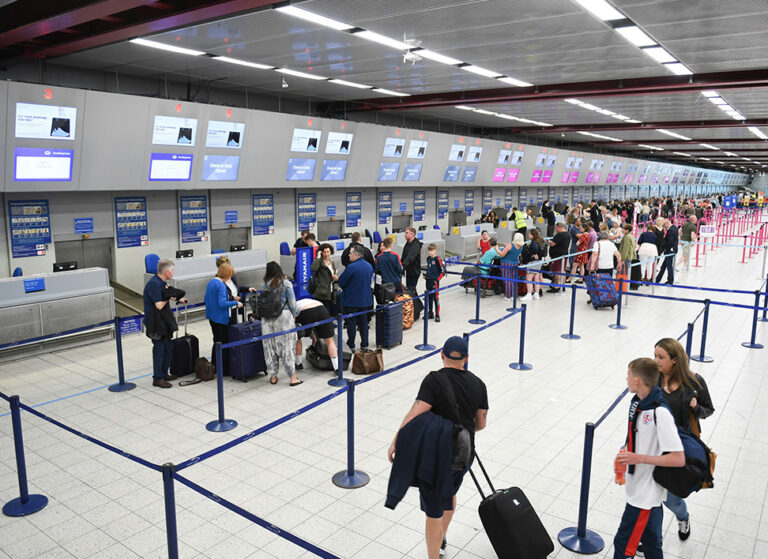
Vionvision AIoT not only counts passengers as they board and disembark from public transportation, but also monitors the flow of passengers around the station and displays current occupancy levels. For example, queues can be monitored, showing the number of people currently waiting and the average queue time. The system will display a map of activity hotspots, which knows exactly when and where people stop. Find out which entrances and areas have the highest footfall and at which times of the day. For retailers in the station, it is also possible to count the number of people in each retail unit.

As part of the long-term goal of big data analytics, smart cities are using automated people counting and integrated analytics. IoT combines common people counts with multiple integrated parameters of passenger counts (demographics, dwell times, heatmaps, mobility patterns, behavioral activity, etc.), vehicle counts, and environmental, social, and governance monitoring. This kind of data management - acquiring, validating, storing, protecting, processing information and making it available as needed, which helps provide insights into people's behavior and makes towns and cities better places to live.
