/ 01 Solutions
Heatmaps & Zone-based Footfall
The very first step to fine-tuning your operation and management based on comprehensive detailed in-store customer behaviors and data applications
Full-trajectory Customer Journey
In-Store Analytics
Store Heatmaps & Zone-based Footfall
From store-level heatmaps to zone-based footfall analysis, Vionvision now enables zone or shelf footfall insights.
Store-Level Heatmap
Vionvision measure store-level heatmaps by dwell-time & traffics. These insights help retailers identify hotspots and dead zones, compare performance by time period, and optimize layout, staffing, and merchandising to improve engagement and conversion.
Virtual Boundary Zone-based Footfall Analysis
Zone-Based 4-in-1 Footfall measures unique visitors, dwell time, demographics, and staff-excluded traffic for every zone in the store. Retailers can easily compare zone performance and view results in clear visual maps—helping identify hotspots, optimize layout and staffing, and improve conversion.
Attention Visitor Counts by Zones
By analyzing dwell time and attention visitors in each zone (customers who stay in a zone longer than a defined threshold), retailers can identify high-attention displays, underperforming areas, and opportunities to optimize layout, merchandising, and staff deployment—turning shopper attention into stronger engagement and higher conversion.
Zone Correlations
Understand Zones/Products Correlations

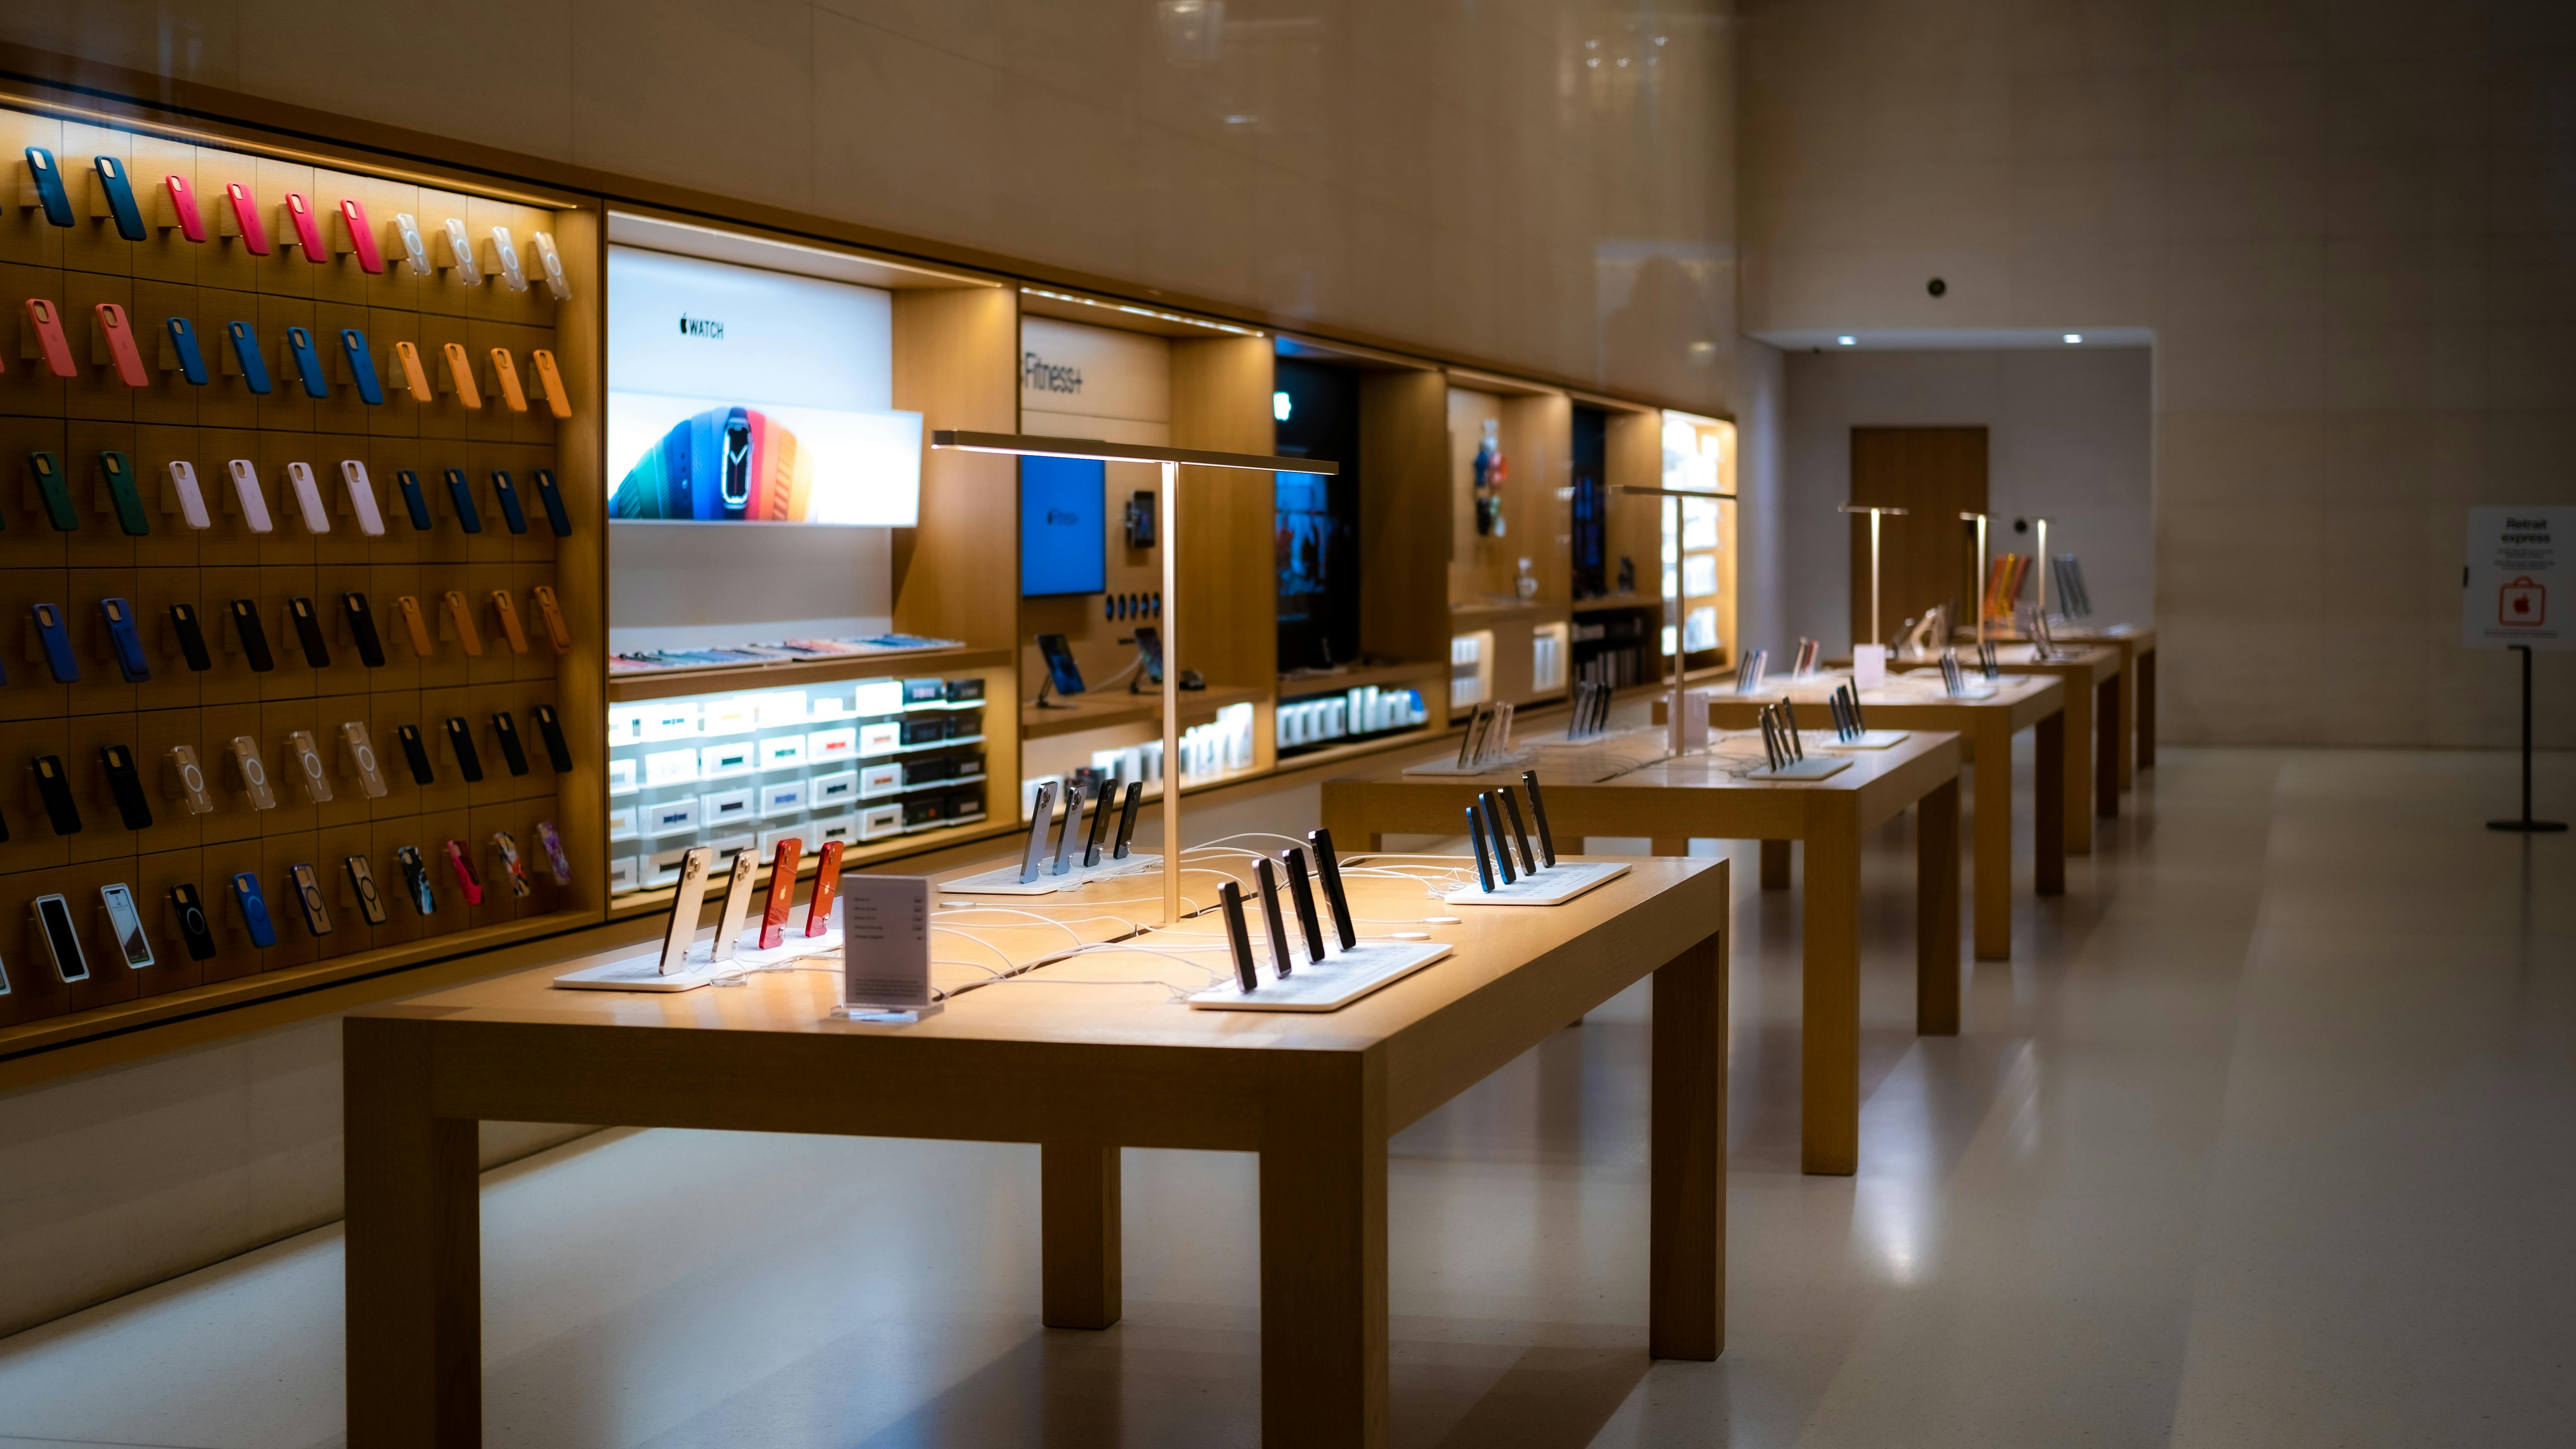
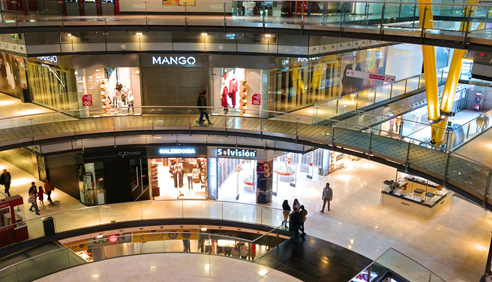
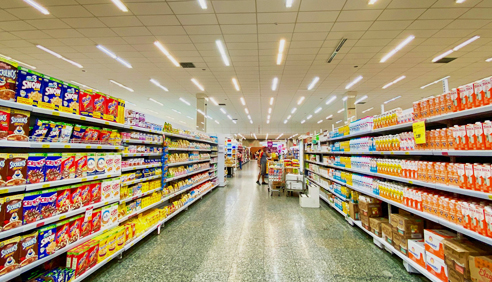
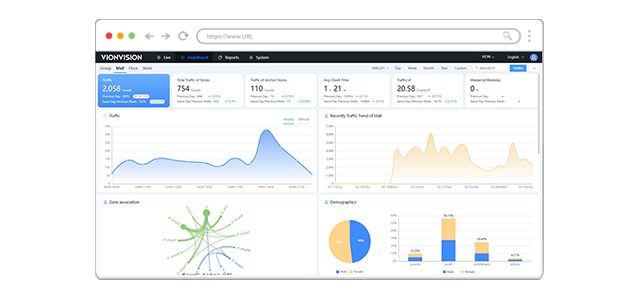
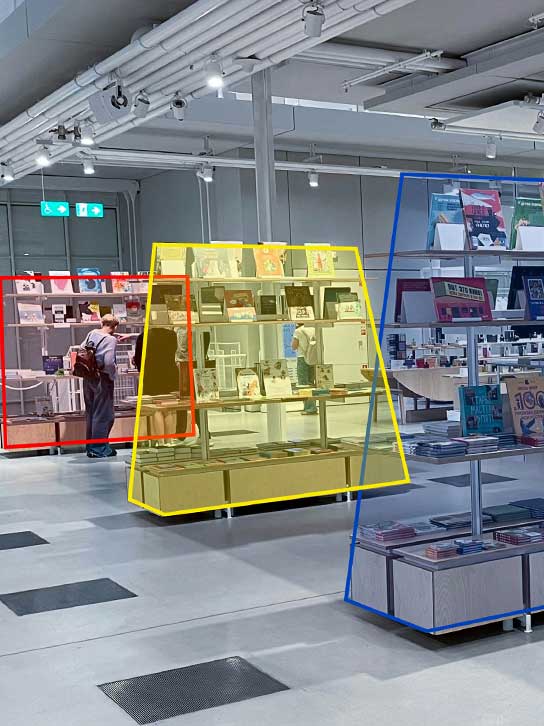
Vionvision in-store analytics help retailers understand key zones by showing where shoppers came from before entering an area—and where they go next. By visualizing zone-to-zone movement and correlation, the platform reveals traffic drivers, dead zones, and cross-category shopping patterns. Retailers can identify which displays attract visitors, which zones successfully lead to deeper store exploration, and where customers lose interest or drop off. These insights support smarter layout planning, adjacency optimization, and targeted merchandising—helping increase dwell time, boost engagement, and ultimately improve conversion.


Full-trajectory Customer Journey
Customer Path Analysis and Marketing Effectiveness Measurement
Unleash the potential of our marketing effectiveness measurement solution by utilizing the power of people statistics analysis to understand target customer profiles, customer engagement with specific layouts, and pathways to marketing touchpoints.
Full Trajectory Customer Journey & Preferences

By deploying G5/G6 smart sensors throughout your facility, you can visualize people movement patterns, including areas of stay and popular locations. By integrating with the sensors, our data analytics platform delivers this data to you.


By integrating with engagement analysis and zone-based footfall heat map, you can see tracking maps that show the entire customer journey for each visitor. By knowing this information, you can place ads in the optimal locations to further improve marketing results. It also helps you manage layouts effectively by providing the information you need to design stores that match typical traffic patterns.


Evaluate Marketing Campaign Engagement

By utilizing data on how long customers spend in front of billboards, you can gain insight into the effectiveness of your campaigns. Conduct A/B testing to optimize your marketing strategy and adjust your approach to achieve maximum results.

Interested in learning more?
Request a demo
By clicking “Accept All Cookies,” our website uses only strictly necessary cookies to enable its functionality, with no data tracking of users.
VionVision Chatbot
Feb 21,2026