CEO, Vionvision PTE Ltd.
Highlights:
* Binocular footfall sensors use two imaging sensors and stereo algorithms to generate depth map sequence to detect and track pedestrians.
* Monocular footfall sensors use one imaging sensor and detect and track pedestrians directly in image sequences.
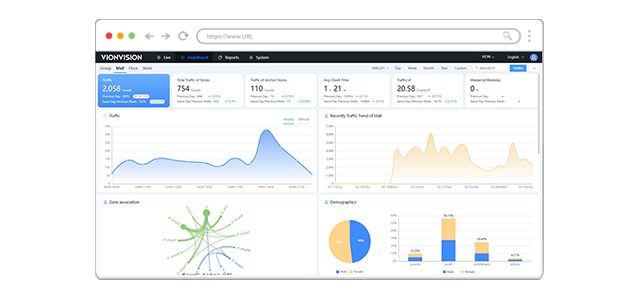
* Image sequence based processing can provide new functionalities including non-intrusive staff exclusion, visitor repeats removal, dwell time distribution, demographics, group analysis, staff excluded heatmap, product engagement, zone traffic, queue waiting time and abandonment analysis and many more.
The importance of utilizing computer vision technology for footfall analysis is surging as global businesses compete for competitive advantage, with the global market size expected to reach US$3.52 billion by 2032 [1]. These people counters process imaging sensor data to measure visitor traffic and provide actionable insights on how to optimize operations and enhance the customer experience in industries as diverse as retail stores, supermarkets, restaurants, public transportation, amusement parks, and event management.
Optical information-based people counters can be categorized according to the number of imaging sensors they use: binocular sensors use two sensors, compute an intermediate depth map based on stereo algorithms, and then segment and track people in the depth map. Monocular people counters use one sensor and apply pedestrian detection and other computer vision algorithms directly to the sensor image to acquire footfall data.
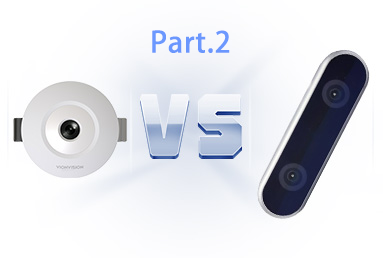
Comparisons between binocular and monocular pedestrian flow sensors, as well as the longstanding debate about the merits and promise of both, go beyond mere technology evaluation and should include consideration of important factors such as richness of functionality, robustness of accuracy, cost-effectiveness, and privacy protection. To answer these questions, it is critical to understand the technology behind them.
The purpose of this article is to provide an in-depth look at monocular and binocular people counters. The article is divided into three parts, the first part explains the technical principles used in these two sensors and how they have evolved over the last two decades. The second part compares in detail various aspects of these two sensors. The third part highlight the future development directions of the visual footfall sensors and how end users choose footfall sensors, and more generally retail sensing products in different application scenarios.
The binocular camera calculates the depth map by measuring the disparity (the difference in position of the field points of interest in the images of the two sensors) along the horizontal direction by means of an image patch matching algorithm. The disparity map is then converted to a depth map using Equation (1). An example depth map is shown in Figure 2, where the gray levels of the image reflect the depth z. Pedestrians in the scene create depth peak areas, which can be detected using an image analysis algorithm. Note that the image sensor can acquire up to 30 images per second, so depth maps can be generated at the same frame rate. Based on the depth map sequence, motion information can be calculated to determine whether an object is entering or leaving the entrance. Depth maps can also provide information about the height of visitors to distinguish children from adults, as well as shadows and reflections from real pedestrians.

Figure 1. The Point Grey Bumblebee2 binocular sensor.
The depth map is calculated in the overlapping area of the two camera views, so the FOV (field of view) is narrower than with a monocular sensor with the same optical system. Additionally, a preprocessing step called "rectification" is required to correct for lens aberrations before a valid disparity calculation can be performed. This usually requires very careful calibration of the lens aberration parameters. Figure 3(a) shows a typical binocular vision processing flow.

Figure 2: A typical depth map calculated in a binocular footfall sensor [2].

Figure 3: The processing block diagrams of (a) a binocular footfall sensor, and (b) a monocular footfall sensor.

Figure 4: The relationship between baseline b, object depth z and disparity d in a stereo sensing system with focal length f. [Courtesy of Sing Bing Kang].
As illustrated in Figure 4, the disparity d is related to depth z and baseline b (the physical distance between the two image sensors) as follows
d = f*b/z···························(1)
Where f is the focal length. Equation (1) easily explains why binocular sensors mounted on high ceilings in airports need to have wider baselines than sensors mounted on low ceilings in store entrances. That is, to create the same disparity d with imaging sensors of the same resolution, the baseline b should be proportional to the object depth z. If a binocular sensor is mounted 6 meters above a pedestrian's head, to match the depth sensitivity to a binocular sensor mounted 2 meters above, the baseline needs to be 6m/2m= 3 times wider.
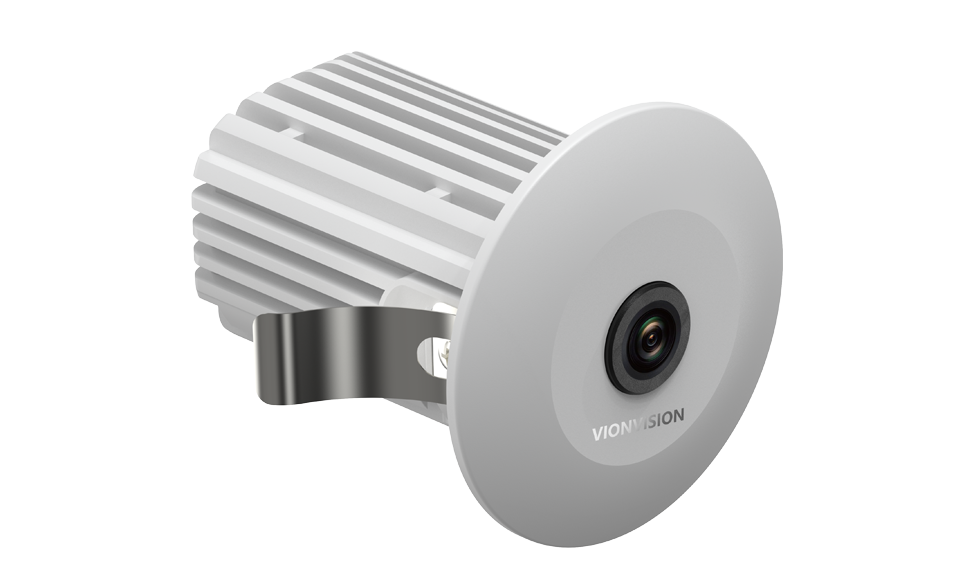
The monocular footfall sensor (shown in Figure. 5) utilizes a single lens imaging system to capture and analyze footfall data. A typical processing block diagram is shown in Figure 3(b). The main algorithms include pedestrian detection, pedestrian pose estimation and tracking, and pedestrian feature extraction.

Figure 5: The G5 footfall sensor from Vionvision, Inc.
Over the past twenty years, the algorithms within monocular footfall sensors changed dramatically due to developments in artificial intelligence and the chip industry.
Early monocular sensors relied on complex image change-based detection of moving pedestrians and so-called "blob tracking" to compute pedestrian data (Figure 6). These sensors were susceptible to spurious image change interference such as shadows or reflections. In general, the accuracy is not as good as binocular sensors, which can filter out these interferences with depth information.
In recent years, with the development of deep learning technology and the leap in SOC chip computing power, the new generation of monocular footfall sensors incorporates the latest pedestrian detection and tracking algorithms to achieve extremely high accuracy and robustness against all of the above mentioned disturbances (Figure. 7).
In addition, because monocular sensors process raw image data, they can extract much more detailed information than depth-map-based binocular sensors and employ so-called Re-IDentification of people (ReID) technology (Figure. 8) to provide new functionality, including reliable staff exclusion, visitor repeats removal, dwell time distribution analysis, demographics, group analysis, staff excluded heatmap, product engagement, in-store zone traffic analysis, queue waiting time and abandonment analysis and many more. Another feature of ReID technology is tracking across non-overlapping sensor coverage areas, which greatly reduces the number of sensors required for in-store analysis.

Figure 6: Image change based pedestrian detection [3].


Figure 7: Pedestrian detection using deep learning algorithm [4].

Figure 8: The non-biometric ReID algorithm matching pedestrians across non-overlapping views [5].
References:
[1] SPER Market Research, the Global People Counting System Market
[2] Malawski, F. (2014). Top-view people counting in public transportation using Kinect. Challenges of Modern Technology, 5.
[3] Sergiu, Mezei & Darabant, Adrian. (2010). A computer vision approach to object tracking and counting. Studia Universitatis Babes-Bolyai : Series Informatica. 55.
[4] Xiao, Y.; Zhou, K.; Cui, G.; Jia, L.; Fang, Z.; Yang, X.; Xia, Q. Deep learning for occluded and multiscale pedestrian detection: A review. IET Image Process. 2021,15, 286–301.
[5] Sun, Z., Wang, X., Zhang, Y. et al. A comprehensive review of pedestrian re-identification based on deep learning. Complex Intell. Syst. 10, 1733–1768 (2024).